
Summary: Post-test questionnaires like the SUS measure perceived usability of an entire system; post-task scales suggest problematic parts of a design.
During usability testing, UX researchers often ask participants to provide a subjective assessment (usually in the form of a rating) of their experience using a product or a site. Instruments such as the SUS, NPS, or the task-difficulty question are among the most popular choices. However, for many new UX practitioners, the precise purpose of these tools (and the correct way to administer and analyze them) is often mysterious. What do they truly assess, and what’s the proper methodology for using them? When should they be administered — in-between tasks or at the end of the session, and why does that matter? Why would you use one of the standard questionnaires rather than create your own?
All these questionnaires represent self-reported quantitative data; they are rarely meaningful by themselves, with no performance data (such as success rates or task times) to complement them. The format for all these questionnaires is usually a rating scale: the participant is given a question, and asked to select an answer, typically on 5- or 7-point scales (we don’t recommend using a scale with more than 7 options). The actual method of collecting the data is straightforward: the questions can be administered on paper by the test facilitator, or using a digital survey tool (which is the typical method used in remote unmoderated testing). However, knowing when and why to use which questionnaire is much more elusive for many budding test facilitators.
There are two categories of questionnaires used during usability testing:
Post-task and post-test questionnaires aren’t incompatible; in fact, in most quantitative studies, it’s useful to collect both. (But be careful about tiring out your participants!) While these metrics do correlate fairly strongly, it’s not a perfect relationship; one type of quantitative data gives us a rather limited picture of the overall usability of the system, and the more metrics, the clearer the picture we can develop.
Both these types of instruments are indicators for the current state of the subjective user experience; you can use them to compare your current design against future iterations (or known industry benchmarks). These metrics do not tell you why users struggle with your design, nor do they provide direct insights as to how you can improve it. They simply are a way of keeping track of how your users feel about the experience of using your product.
It is critical to note that these questionnaires are quantitative instruments, and therefore they require larger sample sizes (typically at least 20–30 users) to be confident that their results generalize. Collecting quantitative data with small sample sizes (such as the 5 users we typically recommend during formative, qualitative usability testing) will almost certainly not generate statistically significant findings. However, if you combine a subjective rating scale with the follow-up question, Why did you give [site X] a score of [Y]? you can derive useful qualitative insights into what people feel about the design, even if you only test a handful of users. (Just don’t make a big deal about the average score.)
In most cases, we recommend using standard questionnaire over homegrown ones, since the former are supported by a lot of research to demonstrate their validity (that they actually measure what they intend to measure), reliability (that users will consistently answer the questions in the same way), and sensitivity (that they can detect meaningful differences).
The most well-known questionnaire used in UX research is the System Usability Scale (SUS). The SUS has been around since the command-line interface days of the 1980s, and has been repeatedly demonstrated experimentally to be valid and reliable. It was invented by John Brooke at Digital Equipment Corporation. The SUS is a post-test instrument, given to a participant after an entire usability testing session is over (or, when testing multiple sites, like in competitive evaluations, after the participant has worked on all the tasks related to a site).
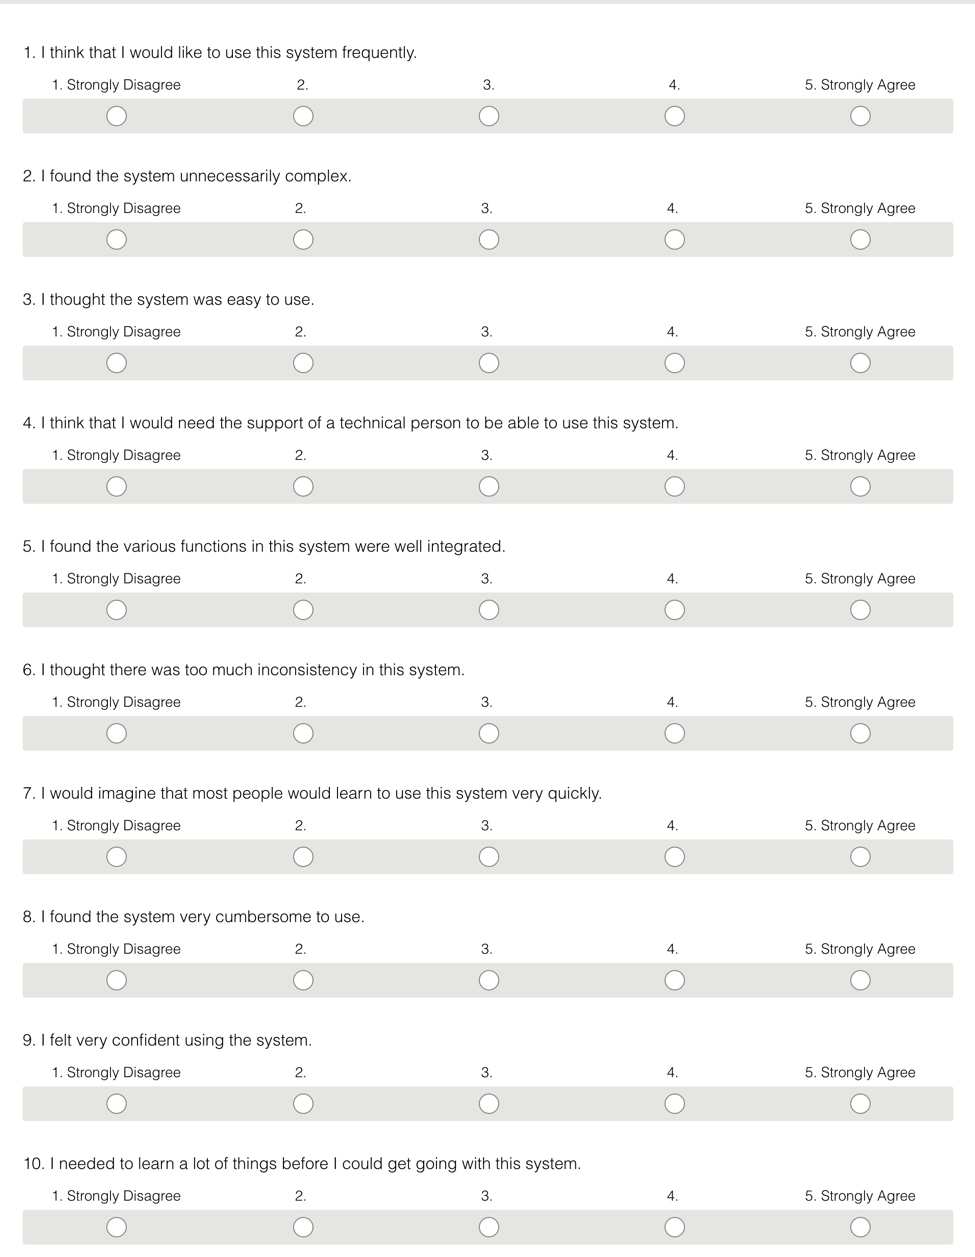
The SUS is a series of 10 Likert-scale questions and produces a score from 0–100. However, the 0–100 score is not equivalent to a percentage score, such as on an exam — Jeff Sauro has done extensive benchmarking of SUS scores on many different systems, and has found an average SUS score of 68 across 500 studies. For your site’s usability to be in the top 10% of all sites, you would need a score of 80 or higher, whereas a score of 73 would place you only in the top 30%.
One of the biggest advantages to using the SUS is that it’s such an old scale that there is a large amount of industry-wide data available to help benchmark your score and understand it in context of your peers and competitors — something that less widely used survey instruments can’t provide. Be aware that the SUS correlates strongly with a much simpler metric, the single-question Net Promoter Score. They do provide different data, but for many organizations, the NPS may be more useful overall, as it’s a simpler metric to collect (one question versus SUS’s 10), and is a well-established general bellwether for the company (even if it’s not as sensitive to UX-focused concerns).
In contrast to the SUS, post-task questionnaires are administered at the end of every task in a test session. They are useful for two big reasons:
Post-task questionnaires need to be short (1–3 questions) to interfere as little as possible with the flow of using the site in a testing session.
There are several widely used questionnaires in use; in most cases a single question instrument is the right fit for quantitative usability testing, because it takes little time and effort for participants to answer it after a task and is minimally disruptive. Since time with users is precious, it’s best to use an efficient survey instrument. More rating questions only give you marginally more insights than what you derive from a single question, so it’s better to invest your time budget in other activities, such as additional test tasks, than to ask more subjective-rating questions.
The “Single Ease Question” (SEQ) is a useful and simple version of this idea that has been experimentally validated and demonstrated as reliable, valid, and sensitive. The SEQ asks the user to rate the difficulty of the activity they just completed, from Very Easy to Very Difficult on a 7-point rating scale.

The finer granularity of post-task questionnaires may suggest that they could generate more actionable findings for design teams than the coarser finding of the user’s overall impressions through a post-test instrument. However, there is less data available for comparing your SEQ results with those from other companies (and the tasks being compared would need to be comparable anyway), so you’re mainly restricted to finding out what tasks are relatively easier or harder within your own system.
The NASA-TLX (Task Load Index) is another type of post-task questionnaire that is useful for studying complex products and tasks in healthcare, aerospace, military, and other high-consequence environments. It tends to be used less frequently in UX work, but it is the standard questionnaire used by many studies in Human Factors and Ergonomics. The NASA-TLX emerged in the 1980s, as a result of NASA’s efforts to develop an instrument for measuring the perceived workload required by the complex, highly technical tasks of aerospace crew members.
The NASA-TLX contains 6 questions that users must answer on an unlabeled 21-point scale, ranging from Very Low to Very High. Each question addresses one dimension of the perceived workload: mental demand, physical demand, time pressure, perceived success with the task, overall effort level, and frustration level. After this initial assessment, users weigh each one of the six categories they just completed, to indicate which category mattered most to what they were doing. It’s a complex instrument to score, but thankfully NASA has released the TLX as a free iOS app.

While the NASA-TLX is often used as a key metric in human factors studies about complex, mission-critical systems, it can also be used in other types UX research, with a few caveats:
Because of the complexity of this instrument, it’s not typically a good match for UX studies of consumer products or simple workflows. For highly complex processes, performed by trained workers, where users cannot choose which application they use and errors have high consequences, the NASA-TLX is the questionnaire of choice. Like the SUS, the NASA-TLX has published many studies and industry benchmarks to help you understand the scores in context, and to be able to meaningfully compare them to those of competitors.
All the various satisfaction metrics discussed in this article suffer from the following limitations:
Self-reported data that addresses users’ satisfaction and perception of usability is often collected in quantitative studies together with other types of performance measures. Three popular instruments are: the post-test System Usability Scale (SUS), which provides helpful information about a user’s takeaways and overall experience; the post-task Single Ease Question (SEQ), which offers information about the usability of different task flows; and the post-task NASA-TLX, which is appropriate for measuring workload in complex, mission-critical tasks. Since all of these are quantitative measures, they require a reasonably large sample size to provide valid measurements.
For most practical UX research, we recommend simple satisfaction questionnaires, with as few questions as possible. The question to ask depends on your research goals: